반응형
gradient decent 를 이용하여 사인함수를 예측하는 예제입니다. 설명은 주석으로 대신합니다.
import math
import torch
import matplotlib.pyplot as plt
#data생성
x=torch.linspace(-math.pi,math.pi,1000)
y=torch.sin(x)
#weight 초기화
w0=torch.randn(())
w1=torch.randn(())
w2=torch.randn(())
w3=torch.randn(())
learning_rate=1e-6
MSE_list=[]
#gradient decent 적용
for epoch in range(30):
#예측 함수 설정
y_pred=w3*x**3+w2*x**2+w1*x+w0
#loss
MSE=(y_pred-y).pow(2).sum().item()
#gradient 계산
grad_w3=(2*(y_pred-y)*x**3).sum()
grad_w2=(2*(y_pred-y)*x**2).sum()
grad_w1=(2*(y_pred-y)*x).sum()
grad_w0=(2*(y_pred-y)).sum()
#update
w3 = w3-learning_rate*grad_w3
w2 = w3-learning_rate*grad_w2
w1 = w3-learning_rate*grad_w1
w0 = w3-learning_rate*grad_w0
MSE_list.append(MSE)
print(f"epoch{epoch+1} loss:{MSE}")
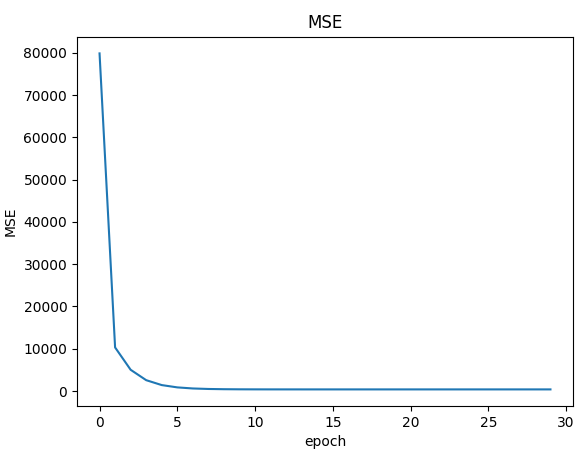
#MSE 를 그래프로
fig, ax = plt.subplots(1,1)
ax.plot(MSE_list, label='MSE',linestyle='solid',marker='')
#ax.legend()
ax.set_title('MSE')
ax.set_xlabel('epoch')
ax.set_ylabel('MSE')
plt.show()
아래는 출력 그래프입니다. 오차값을 나타냅니다.
반응형
댓글